
Executive Summary:
On November 18, 2016 the New York Times[1] reported on the ValChoice Report that identified and quantified the economic conflict that exists between policyholders and shareholders of publicly traded auto insurance companies. This new report is an update to those earlier findings with three key points.
- The cost of the conflict is rapidly increasing (see chart 1 below).
- The problem directly impacts the ability of consumers to collect valid insurance claims when losses occur. The section titled “How Ownership Structure Impacts the Likelihood a Company Delays or Denies Insurance Claims” covers this point.
- The incentive structure of publicly traded companies is likely to cause the problem to continue to worsen.
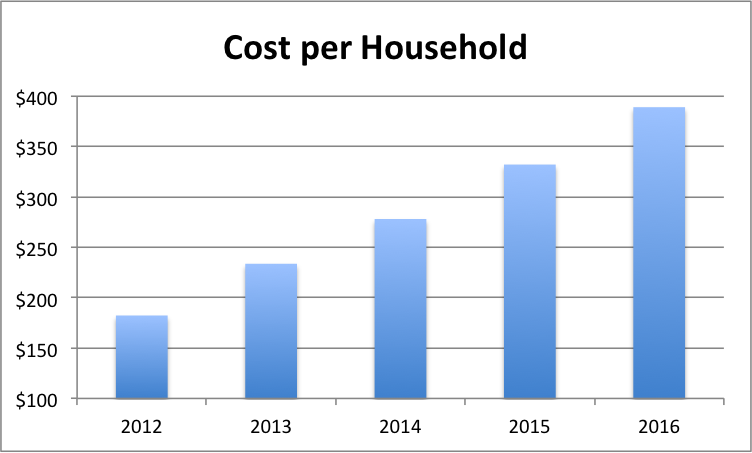
Chart 1: Five-year cost per household
Despite the fact that publicly traded car insurance companies have a lower product quality (as measured by value and the frequency with which the company delays and denies valid insurance claims) than competitors, they continue to gain market share. This is in contrast to mutual companies who offer better quality, yet continue to experience declining market share. Reasons for this phenomenon, and what can be done about it, are discussed in the conclusions section of the report.
Consumers are required by law to buy vehicle insurance. With the five-year trend of declining value for the insurance consumers must purchase, it’s imperative that regulators and lawmakers take action to ensure consumers are getting the protection they are mandated to purchase.
Helping consumers get quality protection and a good value from their insurance can be achieved by bringing transparency to the insurance industry. While not the only possible solution, transparency will deliver consumers the protections and information they deserve when buying services to protect their financial future. Furthermore, transparency is the most cost-effective method for delivering this information.
Click this link to get more information in insurance in your state.
Click this link for an infographic summarizing this report.
The Analysis
The ValChoice analysis included 67 publicly traded auto insurance companies and 114 mutual insurers.[2] Excluded from the examination are the 99 closely held, or privately owned, auto insurance companies. While the closely held carriers are large in number, the collective market share is small. The small market share results in a relatively minor effect on competitive dynamics. Also excluded are non-profits and government entities, for the same reasons.
In 2016, the 181 companies examined represented 93% of the U.S. car insurance market. The company types were grouped into the following three categories:
- Publicly traded corporations
- Mutual and reciprocal companies[3] are combined into the mutual category
- A subset of mutual and reciprocal companies that paid dividends to policyholders during the three-year period from 2014 to 2016.
The market share for each of the three categories in 2016 is listed below. A graphical depiction of the market share is shown in image 1.
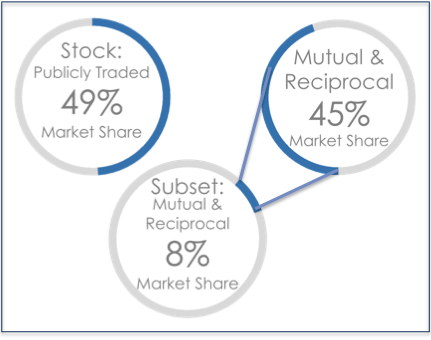
Image 1: Market share breakdown. Stock and Mutual combine for 94% of the market. The 8% shown at the bottom of the image is a subset of the mutual market segment.
- Publicly traded corporations represented 48.8%[4] of the market.
- The mutual company category represented 44.5% of the market.
- A subset of the mutual category of companies includes dividend paying mutual companies that insured 7.7% of the market.
Loss Ratio by Company Type
First, each of the 181 mutual and publicly traded U.S. private passenger auto insurance companies that sold car insurance in the last five years were assigned to the categories identified above. The analysis then compared the percentage of earned premiums net of dividends to policyholders, per year, that were paid out in loss compensation. This ratio is the Paid Loss Ratio (PLR)[5].
Chart 2 plots the paid loss ratio for each of the three categories of companies over the five-year period. A higher paid loss ratio means more of the premiums earned on the sale of insurance are paid out when insurance claims are filed. Higher paid loss ratios represent a better value for the consumer while a lower paid loss ratio represents a worse value.
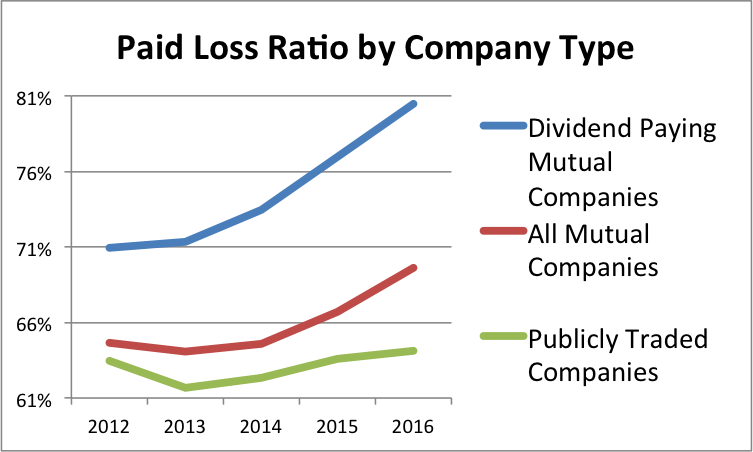
Chart 2: PLR for each of the three company types is shown in this chart. Publicly traded stock companies have the lowest PLR. The mutual company category offered a materially better value than publicly traded companies. The best value were the dividend paying mutual companies.
Chart 2 also shows a consistent stratification, by company type, with publicly held stock companies offering the least value as shown by having the lowest paid loss ratio. Dividend paying mutual companies offered the best value to consumers.
Differences in Loss Ratio by Company Type
In 2012, mutual companies had a 3% higher paid loss ratio than publicly traded companies. With the exception of a minor dip in 2014, the difference continued to increase in subsequent years. By 2016, this comparison had increased to a difference of nearly nine percent.
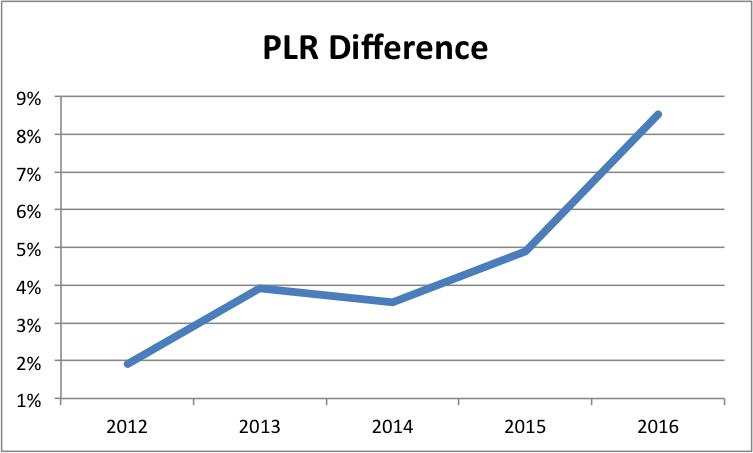
Chart 3: The percentage increase in PLR for the mutual category of companies as compared to publicly traded.
As can be seen in chart 3, the magnitude of the value gap more than quadrupled in the five-year period from 2012 to 2016.
How Ownership Structure Impacts the Likelihood a Company Delays or Denies Legitimate Insurance Claims
The analysis of differences in the handling of legitimate insurance claims used confirmed complaint data collected and vetted by the state insurance commissioners. To examine the frequency with which a category of companies delays or denies insurance claims, three categories of complaints were examined. The three categories included: complaints due to delays in payment, unsatisfactory offer for settlement or an outright denial of insurance claims. The analysis shows that per dollar of insurance sold publicly traded auto insurance, companies received 15% more complaints for insurance claims related issues[6] than mutual companies received.
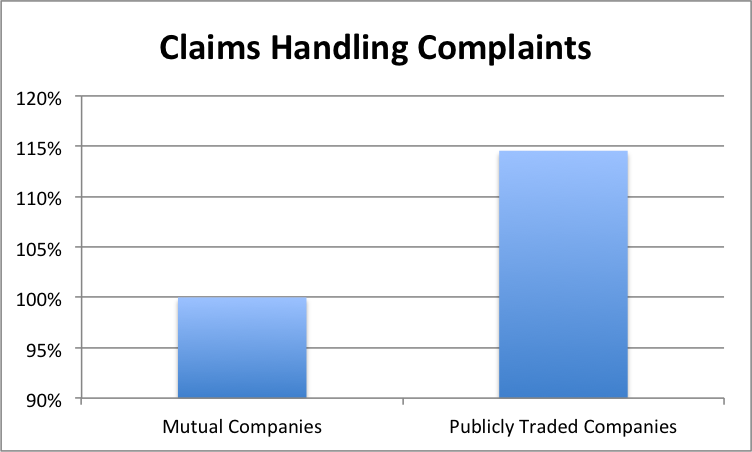
Chart 4: Difference in confirmed complaint volume during the five-year period from 2012 through 2016. Higher complaint ratios indicate a higher frequency, per dollar of earned premium, of insurance claims subjected to delays or denials. This measurement is strictly for insurance claims deemed to be legitimate insurance claims.
Little Uniformity Within Categories of Companies
While there is a clear difference in operating methodology between publicly traded companies and mutual companies, this does not imply there is synergy between companies of a single type. Chart 5 shows the variance in PLR between two large[7] mutual companies. Both companies enjoy a similar and a significant percentage of the overall auto insurance market.
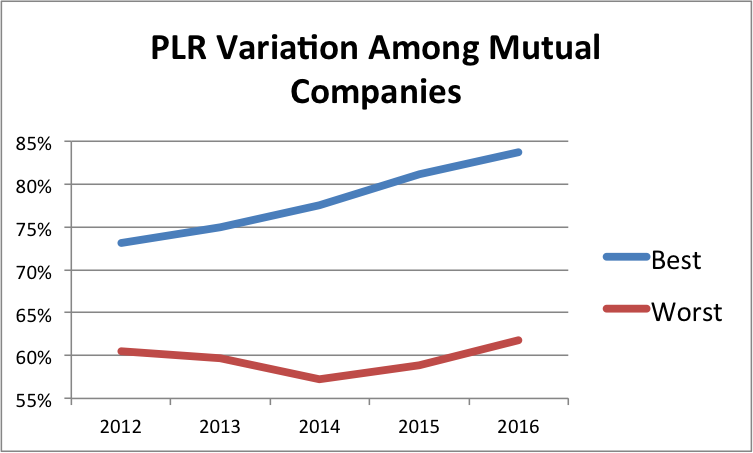
Chart 5: Highest and lowest performing large mutual companies.
By contrast, the publicly traded corporations have a more similar operating methodology than mutual companies. As can be seen in chart 6, the PLR of the highest and lowest performing carriers is a 13% average difference compared to the 31% average difference for mutual companies.
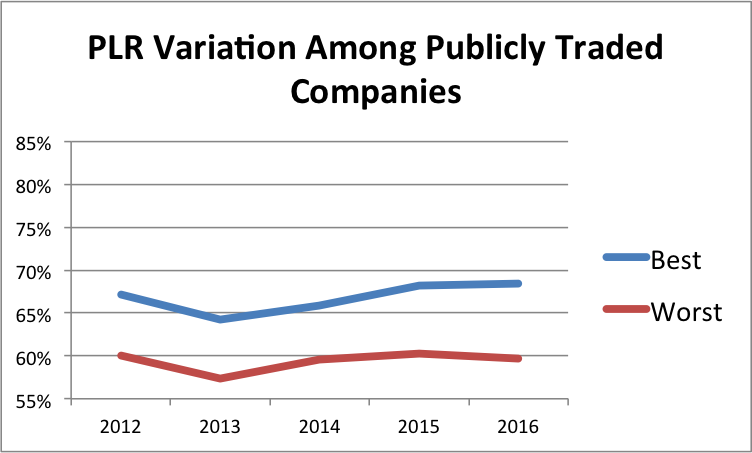
Chart 6: Highest and lowest performing large publicly traded auto insurers.
The analysis concluded that the lowest performing mutual carriers and the lowest performing publicly traded carriers offered a similar value proposition and a similar claims experience. The notable difference was that the high value, good claims experience segment of the mutual market was almost non-existent in the publicly traded carrier market segment.
In conclusion, the difference isn’t that mutual companies are universally better. Instead, the difference is that most mutual companies perform better for policyholders and some perform significantly better than publicly traded auto insurers.
Changes in Market Conditions Over the Five-Year Period
The industry experienced an increase in loss ratios beginning in the year 2014. Reasons for increasing loss ratios were in large part due to more insured losses (accidents to cover). For some companies, more aggressive pricing was also a factor. Considering only the trend toward increasing losses rather than pricing, the following are three of the reasons cited for the increasing losses.
One, following a downturn in passenger car miles driven in the U.S. in the second half of 2007, miles driven began increasing again in the summer of 2014[8]. In 2015, the miles driven surpassed the record previously set eight years earlier[9]. In 2016, miles driven continued at historic high levels. The 2007 downturn in miles driven led to fewer accidents. Conversely, the increase in miles driven and the record level of miles driven led to more accidents, and consequently, more insured losses.
Two, some studies show that distracted driving is leading to an increase in both accident rates and accidents involving personal injury. Three, the cost of repairing damaged vehicles is rapidly increasing.
Changes in Market Share by Company Type
Despite offering less value and a more difficult insurance claims experience, publicly traded auto insurers are gaining market share. As can be seen in chart 7, the market share gains are at the expense of mutual companies.
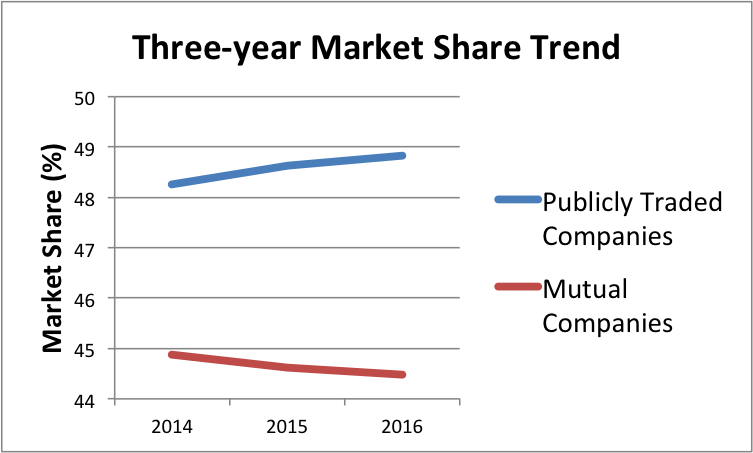
Chart 7: Market share by company type.
Chart 7 shows the difference over the three-year period from 2014 through 2016.
Why the Shareholder Always Tops the Policyholder
In the ValChoice Market Report from November 2016, the section titled “The GEICO Effect” detailed the material impact GEICO had on the PLR of the publicly traded market segment. A summary of The GEICO Effect in the 2016 report is that GEICO had a five-year PLR 4.1 points, 6.6%, greater than the rest of the publicly traded market segment. Representing more than 20% of the publicly traded market, this had a significant positive effect on the performance of the segment.
For a company focused on gaining market share, aggressive pricing and consequently a higher PLR are expected. The question is: Now that they have become the second-largest auto insurance company in the country, when will their focus begin to change?
One early indicator of change could be when the now famous slogan “15 minutes could save you 15% or more” begins to disappear. Replacing advertising campaigns focused on cost savings in favor of campaigns emphasizing reliability or stability makes sense in markets where the company is in the number one market share position. New York and New Jersey, 30% and 20% market share respectively, are two markets that could be an early indicator of the longer term GEICO strategy.
Using PLR data, ValChoice calculated that approximately an $80 increase per vehicle insured would bring the GEICO loss ratio in line with the publicly traded market segment. In 2016, this would have translated into incremental revenue amounting to $2.26 billion. With a P/E of approximately 20, this revenue increase translates into a $45 billion increase in market cap. Increasing the wealth of shareholders by $45 billion is rarely as easy to find as it is in this situation.
Let’s look at who would benefit from this seemingly small price increase. Class A shares would increase $27,000. Class B shares would increase $19 and management would likely receive hefty bonuses for stellar performance.
The loser is the policyholder. Once GEICO makes its move to capitalize on the long-term investment made into building market share, price pressure is reduced across the entire industry. This leads to a less competitive market, and an unfortunate situation for the consumer.
The Cost to Consumers
Approximately eight percent of the industry operates with the business model characterized by dividend paying mutual companies. This is a large enough data set to prove the business model for these companies is viable and scalable. Applying this business model to the rest of the industry over the five-year period from 2012 to 2016 would have yielded:
- $123 billion in savings; more than $1,400 per family[10] that buys car insurance, or
- $93 billion in additional loss payments
- Some combination of the two items above
This extreme cost, born entirely by consumers, has grown year over year for each of the six years ValChoice has examined for this and prior reports.
The worst examples of the cost to consumers is when their insurer delays and denies legitimate claims. Until now, there has been no meaningful analysis showing which carriers have the highest frequency of insurance claims delays and denials.
The root cause of these problems is a direct result of the lack of transparency in the insurance industry. Solving the problem is addressed in the conclusions that follow.
Conclusions
Companies have mission and value statements that state shareholders and customers are treated with equality. However, in reality, executive compensation gets unequal consideration when business decisions are made. The more dollars that are at stake, the more unequal the various parties become. Particularly when it comes to products and services they are mandated to buy, consumers deserve transparency into how companies operate.
While this report points out the risks associated with purchasing insurance from publicly traded insurers, it’s also true that within the market segments of publicly traded and mutual insurers, there is wide variation. Not all publicly traded insurers are worse for consumers than mutual insurers. Also, not all mutual insurers are better for consumers than publicly traded insurers. This makes it necessary for consumers to have access to detailed information about the performance of any insurance company from whom they are considering buying protection.
The low frequency of interaction on insurance claims-related issues makes it nearly impossible for consumers to experientially assess the quality of the insurance products they buy. This low level of product interaction creates branding opportunities through advertising for companies with the financial means to undertake large-scale advertising campaigns. With little or no reliable information available on actual company performance, these branding campaigns drive both market share growth and customer loyalty.
For the singular reason that consumers are required to buy insurance, consumers deserve unbiased, independent information characterizing the performance of the companies from whom they buy. Without such checks and balances in place, market share will continue to migrate to the companies with the largest advertising budgets. As market share migrates to companies with lower quality products, competitive dynamics are reduced and the overall decline in product quality will continue.
The solution to this problem is relatively easy and involves increased transparency. More information should be both collected and made available to data services working to provide transparency into the operation of insurance companies. Lawmakers and insurance regulators need to embrace and actively promote making more information available for the public to use in assessing insurance providers.
About ValChoice
ValChoice® is the only company to provide consumers, agents and advisors with information on which home and auto insurance companies offer the best price, protection and service. The company’s advanced analytics platform collects and analyzes millions of data points and delivers the results in an easy-to-use service that Forbes Magazine describe as “Carfax for insurance.” Using ValChoice, consumers are finally able to shop for insurance based on value rather than making decisions blindly based on price or advertising campaigns.
ValChoice offers free reports on auto and home insurance companies to everyone. Click the button below below for the type of report you want. To get information on claims handling performance, select the Premium option. The premium option includes a grade comparing companies to their peer group on the frequency with which the company delays and denies claims.
Note: ValChoice does not receive any form of compensation from insurance companies for presenting them as a good option in our car and home insurance comparison reports.
End Notes
[1] November 18, 2016, New York Times column by Gretchen Morgenson, “The Kind of Car Insurer That Gives Consumers the Best Value.” https://www.nytimes.com/2016/11/20/business/the-kind-of-car-insurer-that-gives-consumers-the-best-value.html
[2] The number of companies includes all companies that actively sold car insurance in the U.S. during the period from 2012 through 2016. Publicly traded companies include companies that at any time during that period were publicly held. Being continuously publicly held was not a requirement for being included in the publicly traded count of companies
[3] Reciprocal Exchange and Co-operative companies are included in the category of Mutual Company. Due to the nature of the ownership structure, the New Jersey Manufacturers Group and the Westfield Group are also included in this category.
[4] Market share data per company, Source: © AM Best Company — Used by Permission
[5] Earned premium and dividend to policyholder data source: © AM Best Company — Used by Permission
[6] Complaint data analysis included the years 2012, 2013, 2014, 2015 and 2016. Complaint data is collected by writing company and rolled up to the parent company.
[7] For the purposes of this analysis, “large” companies were defined as holding a minimum of 3% market share, nationwide. Companies below this threshold were not included in the analysis of PLR performance within company types.
[9] https://www.fhwa.dot.gov/pressroom/fhwa1607.cfm
[10] Calculation based on a ValChoice estimate of 217,243,298 auto insurance policies in 2016. For households, the number of insured cars is assumed to be 2.28.
No comments yet.