
The world climate is a hot topic, pun intended. Here at ValChoice, we want you to know how climate change and extreme weather are impacting you. Whether you are a homeowner, or just a concerned citizen, this post shows how climate change and extreme weather is impacting you, your family and your home.
Click the button below to find out if you’re paying a fair price for your home insurance.
Summary of Findings
The results of climate change and extreme weather is our focus. Importantly, it’s not that we’re not interested in the rate of rise in sea level or the change in average temperatures. However, we just don’t believe that data translates into useful information for most people. Instead, we focus on the cost of climate change and extreme weather for homeowners and insurance companies. How are extreme weather and climate change impacting your pocketbook?
The study is based on data from 1980 through 2017. In short, the findings are as follows:
- Storm severity has increased over the measurement period. Consumer Price Index (CPI) adjusted costs increased at a 1.1% Compound Annual Growth Rate (CAGR), based on a ten-year moving average.
- The number of deaths resulting from extreme weather are declining.
Home insurance companies vary significantly in how they perform when it comes to paying claims. Be sure to get a free rating on your home insurance.
Also, find out if your home insurance is fairly priced. Use our home insurance premium calculator to find the average price in your area..
What’s the Impact of Climate Change on Homeowners and Home Insurers?
In any type of serious analysis, it’s imperative to use high-quality data. Therefore, we used data from the National Oceanic and Atmospheric Administration (NOAA)[1]. The NOAA data documents the number of billion-dollar weather and climate disasters that have impacted the U.S. The data available from the NOAA covers the 37-year period from 1980 to 2017. The NOAA data includes the following types of events:
- Drought
- Flooding
- Freezing
- Severe Storms
- Tropical Cyclone
- Wildfire
- Winter Storm
In this analysis, all events are Consumer Price Index (CPI) adjusted. CPI adjusted means that from a dollar cost point of view, all storms are equally represented. Therefore, a storm occurring in 1980 or 2017 are adjusted based on CPI to have an equivalent cost basis.
Average Cost of Billion-Dollar Weather Event
The chart below plots the cost of all weather events with a total cost of more than one billion dollars. The cost of the events was adjusted based on the Consumer Price Index (CPI). Therefore, all events are shown in 2017 equivalent dollars. Using the CPI adjusted average makes it possible to determine how rapidly the cost of these events is increasing.
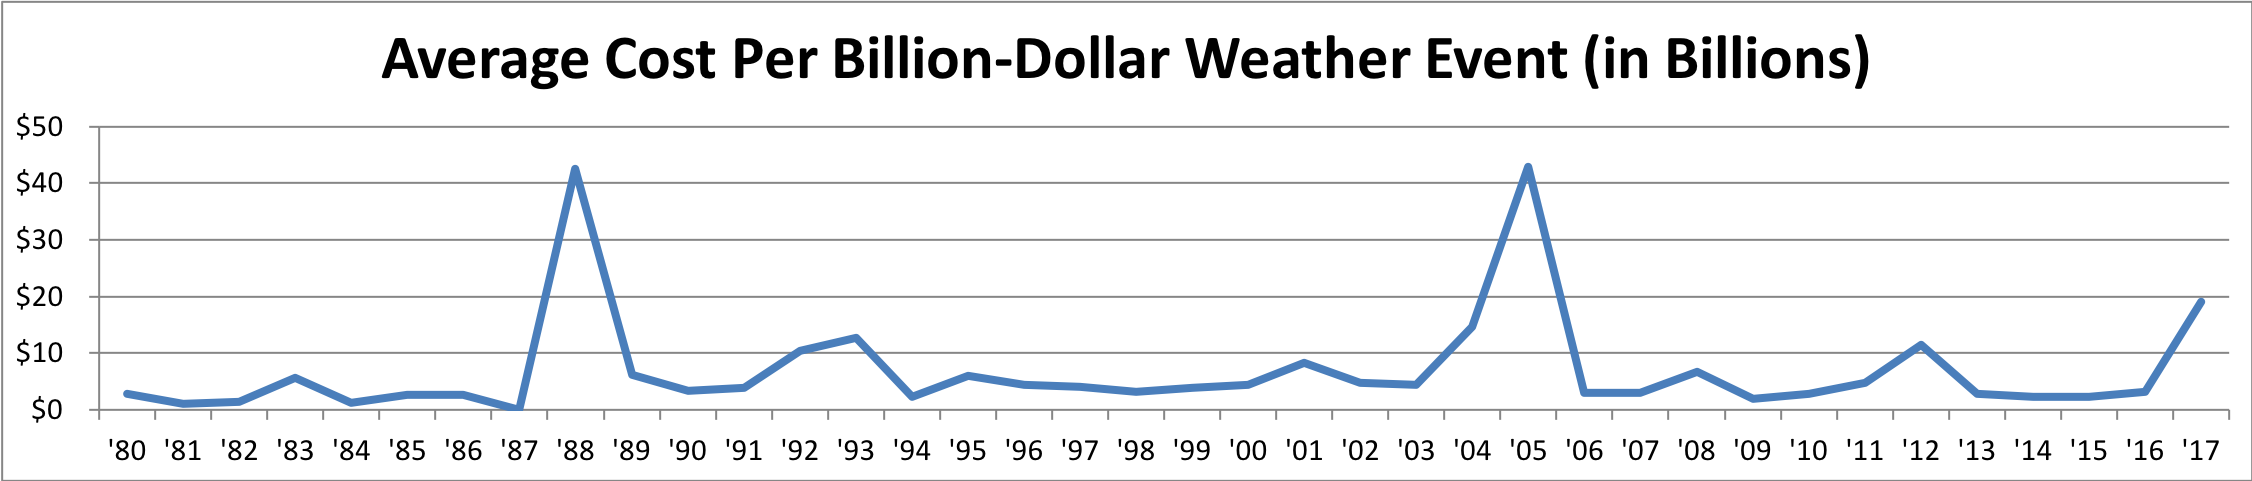
Chart 1: Shows the average cost per year for all storms causing one billion dollars, or more, of damage from 1980 through 2017.
Catastrophic weather events are infrequent. Therefore, to ensure the cost trend is not biased due to a single, large event, or a particularly catastrophic year, we use a moving average. The chart below plots the trend in the cost of weather events based on a 10-year moving average.
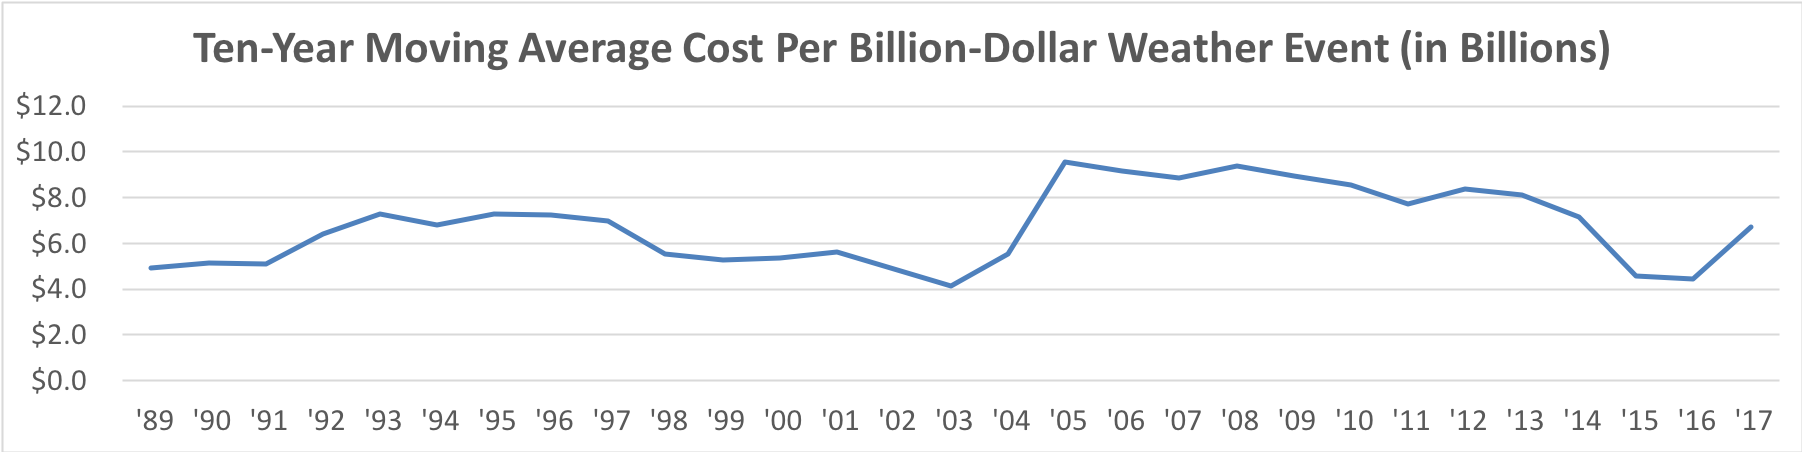
Chart 2: Ten-year moving average of one-billion dollar weather events occurring between 1980 and 2017.
Charts 1 and 2 above both use CPI adjusted data. Therefore, the dollar amounts are equivalent in all years analyzed. The costs are adjusted to 2017 equivalence.
Using the end-points of the ten-year moving average yields a 37% increase in the cost of storms in 2017 as compared to the beginning of the time period. This averages to a compound growth rate of 1.1% per year.
Number of Deaths Related to Extreme Weather And Climate Events
Another method for analyzing the severity of weather events is to look at the number of deaths caused by the storms. The chart below shows the number of deaths, per year, due to extreme weather events.
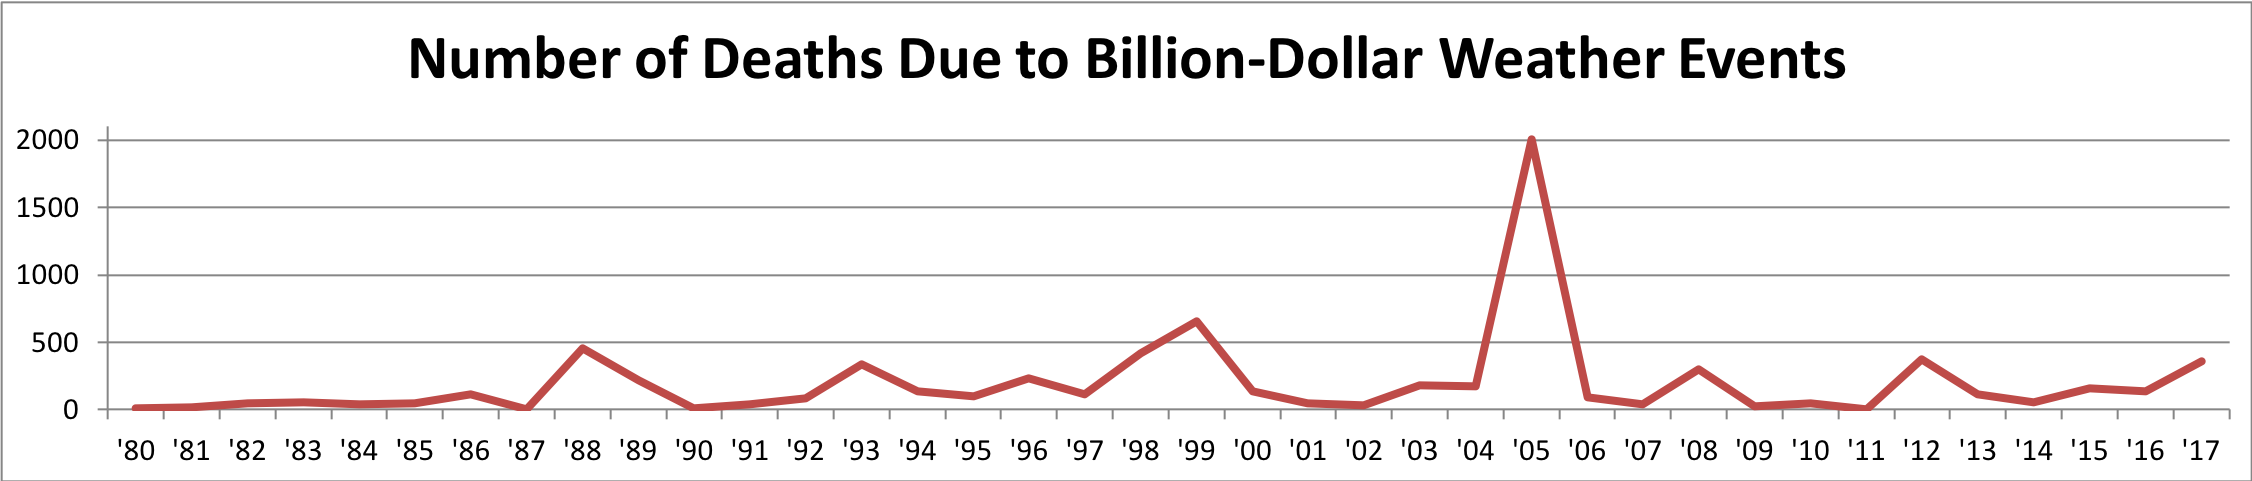
Chart 3: Shows the number of deaths per year for all storms causing one billion dollars, or more, of damage from 1980 through 2017.
Like the cost trend, it’s important to ensure the death trend is not biased due to a single, large event, or a particularly catastrophic year. Therefore, we again use a ten-year moving average. The chart below plots the trend in the based on the ten-year moving average.
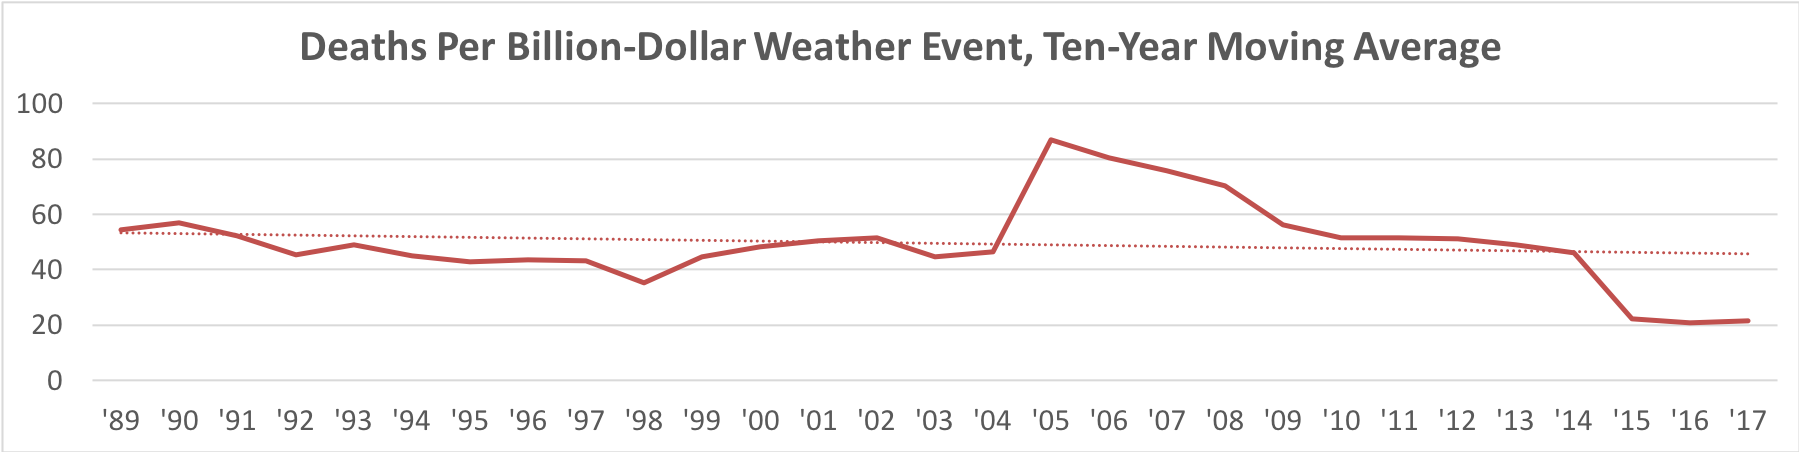
Chart 4: Number of deaths on a ten-year moving average basis for all storms causing one billion dollars of damage, or more, between 1980 through 2017.
Chart 3 shows an increase in the number of deaths per year over the 37-year period measured. However, the increase in the annual data in chart 3 is skewed due to the number of hurricanes that made landfall in 2017. Remember hurricanes Harvey, Irma and Maria? This series of extreme storms, back-to-back, in a single hurricane season had a significant impact on total storm costs and death toll.
The ten-year moving average approach shows the number of deaths is actually trending downward. Using the end points of a linear trend line, Chart 4 shows approximately a 20% decline over the period of the study. Reduced deaths per storm is likely a function of better preparation by homeowners, improved building codes, better technology and better response after extreme weather events. Hence, the number of deaths as a result of weather events may not be a good measure of storm severity.
Is the Frequency of Storms Increasing?
The number of deaths is interesting but doesn’t tell the whole story. The artificial limit of one billion dollars that NOAA put on the data collected eliminates many storms that were strong from the data collected.
Storm severity isn’t the only important metric. Storm frequency must also be considered. Unfortunately, the NOAA data artificially limits the data collected to weather events that cost more than one billion dollars, at the time of the event. This limiting of the data collected has the effect of excluding a larger number of storms the further back in time the analysis goes. Therefore, the NOAA data gives the appearance of an increase in frequency, but it’s not a valid measurement due to the minimum cost constraint on the data collected. We are currently considering other data sources to help us analyze the frequency of weather events.
What a Warming Earth Means for You
The reality of our warming earth is that weather events are expected to become more extreme. As temperatures increase the areas affected dry out and plants become tinder. Land use is a known to be a significant factor in the cause of fires. For more information on the impact of land use, click here for a story in the LA Times. Without improved land management, wildfires will continue.
In addition to heating up, when the weather brings rain, the rainfall is often more intense. The rainfall intensity causes flash floods. Therefore, areas that didn’t previously flood are now prone to flooding.
Steps Homeowners Can Take to Protect Themselves
Wildfires
Keep brush and trees away from your home. Make sure anything that can become fuel for a fire is not near the home.
Rain and Wind
Be sure your roof is in good condition. Heavy winds and rain can cause severe damage to the home if your roof isn’t in good repair.
Flooding
Consider the risk of flooding when buying a home or making improvements. National Flood Insurance Program (NFIP) flood maps are currently not very accurate. With the changes taking place due to climate change, these maps are likely to become less accurate. One reason for this phenomenon is the National Flood Insurance Program is restricted by law to only looking at history. Even in a period when it’s generally agreed that the climate is changing, models of future changes and risks are not considered in the NFIP maps and risk assessments. For more information on flood insurance, read our post “10 Facts About Flood Insurance, Without Drowning in Details.”
For homeowners, look for services that can model flooding for your property. These services need to take into account situations that may not yet have occurred. For example, rising ocean levels, stronger storm surge and heavier rainfall. Examples of services that can provide this type of information for homeowners include companies like Coastal Risk Consulting.
Make Sure Your Insurer Performs Well on Claims Handling
The differences in how insurance companies handle claims is extreme. Don’t buy insurance based on the opinion of others. Often those other people haven’t filed a large claim. Even worse, don’t rely on TV advertisements or reviews when buying insurance. Instead, find out from a data analytics service how good an insurance company is before buying insurance.
Click the buttons below to get a report on your auto or home insurance. ValChoice ratings compare your insurance company to every other insurance company that serves your state. Extreme weather can lead to large insurance claims. Therefore, pay close attention to the “Protection” score in these reports.
Note: ValChoice does not receive any form of compensation from insurance companies for either grading them or presenting them as a good option in our car and home insurance ratings.
Conclusion: Storm Severity Trending Up, Home Insurance Prices Skyrocket
We conclude the severity of storms, in the U.S., is trending upward. This conclusion is based on the ten-year moving average of CPI adjusted costs. However, we temper that conclusion for two reasons:
- The large number of extreme weather events in 2017 materially affected the data trend
- Building costs are increasing due to more technology being incorporated into homes and buildings. Additional technology and more stringent building codes drive costs up beyond the cost of simply rebuilding to the existing condition.
Some may find that not concluding significant change over the time period studied is counter intuitive. One reason some will find this counter intuitive is that we most clearly remember recent events. For example, the severity of hurricanes in 2017 is much more fresh in our minds than hurricanes in 1988 and 2005. Nevertheless, data shows both 1988 and 2005 storms were worse than 2017 both in dollar cost and deaths. Interestingly, 1988 was marked by an unusually high frequency of storms. In total there were 12 tropical depressions that reached tropical storm status and five that reached hurricane status. More notably, 2005 was the year of hurricane Katrina.
The Data We Used in This Analysis
We’re not climate scientists. That’s okay though. We don’t need to be climate scientists because we’re not building models predicting climate change in the future. Instead, we’re mathematicians analyzing high-quality data so you can understand what is taking place. You need to be able to plan a lifestyle on a warming planet. We help with that. We leave it to the climatologists to predict what will happen in the future.
NOAA data is made available to the public by the National Centers for Environmental Information (NCEI).
The NCEI has the high-quality data needed for this type of analysis. The NCEI website states they have “one of the most significant archives for environmental data on earth.” The NCEI mission is “preserving, stewarding, and maximizing the utility of the Federal government’s billion-dollar investment in high-quality environmental data. NCEI remains committed to providing products and services to private industry and businesses, local to international governments, academia, as well as the general public.”
[1] The National Oceanic and Atmospheric Administration (NOAA), https://www.ncdc.noaa.gov/billions/events/, Billion Dollar Weather and Climate Disasters.
No comments yet.