Hurricane Harvey, Irma and Maria Victims Have No Idea About the Storm That Will Hit Them Next
Hurricane Harvey arrived with a bang. A category 4 hurricane means sustained winds of at least 130 mph. For anyone that has put their head out the window of a car traveling 65 mph, double that. That’s the minimum power of Harvey when it made landfall in Texas. Even worse, the heavy winds were accompanied by a storm surge of up to seven feet. Unfortunately, that’s not the end of the Hurricane Harvey story.
Next, torrential rain. In the first couple days some areas had already been drenched with over two feet of rain. The rain continued, in total, delivering up to four feet of rainfall. This torrential rainfall caused widespread flooding in the flat terrain of Texas. Wind, storm surge and then rain. Could the Hurricane Harvey situation have been any worse?
Only 13 days after Hurricane Harvey pounded Texas with 134 mph winds, killing 77, Hurricane Irma made landfall in Florida. Irma brought winds up to 183 mph, killing 134 people and causing an estimated $63 billion in losses. Next, the 175 mph winds of Hurricane Irma flattened Puerto Rico. The death toll is still only an estimate. Some estimates range a high as 500.
These are serious storms. However, the storm that’s coming may be even more painful.
The Storm That’s Coming
Unfortunately, the situation will get worse. In fact, for some it will get much worse. Hurricane Harvey victims will spend years of their life recovering. Some will never recover. Those that never recover are often the victims of what is often called “the storm after the storm.”
Wind vs. Water? Which Did Hurricane Harvey, Irma or Maria Deliver First?
What caused the damage, wind or water? This question is critically important. Here’s why. If flooding caused the damage, homeowners insurance is not responsible for the losses. Instead, the National Flood Insurance Program (NFIP) is responsible. The NFIP is administered by the U.S. Federal Emergency Management Agency. This means if flood insurance premiums are insufficient to pay the claims, federal tax dollars make up the difference. However, most people don’t have flood insurance, or don’t have enough.
After Hurricane Harvey passes, the forensic work to determine what caused the damage requires specially trained personnel. The good news is there are specialists trained to do this work. The bad news for consumers is that these “experts” work primarily for insurance companies.
Taking a lesson from Hurricane Katrina, here’s what happened. In a class action lawsuit filed against an insurance company and their contract engineering firm, the following was revealed. “Contrary to every objective scientific and legal source that the hurricane wind arrived after the storm surge,” the forensic team determined th storm surge arrived first. Storm surge arriving before the wind defies logic. However, that was not the end of the problems for policyholders. In other lawsuits it was revealed that some insurance companies tried to trick hurricane victims. They tricked them by asking the victims to sign forms that acknowledged they had sustained flood damage. Flood damage of course is not covered by homeowners insurance.
For insurers with millions and billions of dollars at stake, saving money are highly attractive. For companies beholden to the insurance industry, saving their customers money could be viewed by some as good business. In fact, it could be the difference between a big contract in future years, or no contract at all.
Modified Damage Reports
60-Minutes reported on similar issues following Superstorm Sandy. Their report included a statement saying, “there is evidence that many homeowners were victims of what appears to be wide scale fraud — where original damage reports were later changed to make it look like the damage wasn’t as bad.”
The Problem May be Getting Worse
When the insurance company has shareholders, the problem worsens. Shareholders are an unrelated third party that only care about the stock price. Boards of directors and top management understand the importance of keeping shareholders happy. When losses are large, boards and executives instinctively want to minimize the impact on shareholders. Not doing so can directly effect personal income in the coming years.
Data proving this is true is publicly available, but rarely analyzed. For more information on this reality, see the ValChoice report titled, “The Type of Car Insurer That Delays and Denies Insurance Claims.”
Avoiding the Storm After the Storm
Homeowners that that are victims of Hurricane Harvey, Irma or Maria and don’t get the service they expect from their insurer, need to file complaints with their department of insurance. Regulators need to quickly vet these complaints. Once vetted, complaints need to be published and publicized. Rapid publication of the complaint data will inform consumers which insurers do not honor the promise to protect.
Transparency will force carriers to honor their promise to protect Texas policyholders. Not doing so would lead to losing customers across the entire country. The risk of having poor behavior exposed creates a powerful incentive to perform well. Transparency will lead to improved service for homeowners everywhere. There’s a second benefit as well. Insurance companies will start to measure their performance based on data available to the public. This will have a powerful, positive effect on both consumers and the industry.
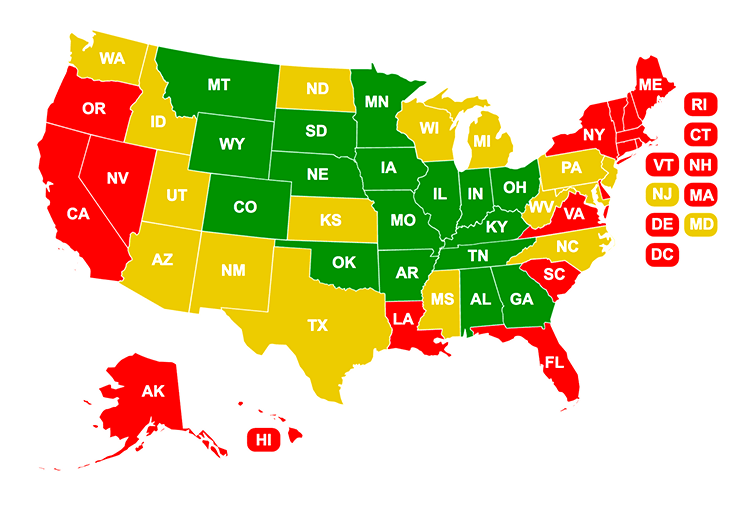
Where You Live Matters
The map below shows all 50 states and how they compare for the value consumers get from their homeowners insurance. A description of the analysis is included in the section titled “Methodology.”
- Alabama, 12th Best
- Alaska, 6th Worst
- Arizona, 20th Best
- Arkansas, 8th Best
- California, 13th Worst
- Colorado, 2nd Best
- Connecticut, 16th Worst
- District of Columbia, 4th Worst*
- Delaware, 7th Worst
- Florida, 2nd Worst
- Georgia, 7th Best
- Hawaii, #1 Worst Value
- Idaho, 23rd Worst
- Illinois, 10th Best
- Indiana, 16th Best
- Iowa, 17th Best
- Kansas, 19th Best
- Kentucky, 9th Best
- Louisiana, 3rd Worst
- Maine, 5th Worst
- Maryland, 25th Worst
- Massachusetts, 11th Worst
- Michigan, 21st Best
- Minnesota, 11th Best
- Mississippi, 21st Worst
- Missouri, 15th Best
- Montana, 4th Best
- Nebraska, 1st Best
- Nevada, 4th Worst
- New Hampshire, 17th Worst
- State of New Jersey, 23rd Best
- New Mexico, 22nd Best
- New York, 8th Worst
- North Carolina, 24th Worst
- North Dakota, 20th Worst
- Ohio, 13th Best
- Oklahoma, 3rd Best
- Oregon, 12th Worst
- Pennsylvania, 22nd Worst
- Rhode Island, 9th Worst
- South Carolina, 10th Worst
- South Dakota, 5th Best
- Tennessee, 6th Best
- Texas, 18th Best
- Utah, 18th Worst
- Vermont, 14th Worst
- Virginia, 15th Worst
- Washington, 19th Worst
- West Virginia, 24th Best
- Wisconsin, 25th Best
- Wyoming, 14th Best
Comparing the #1 Best State to the #1 Worst State
The difference between states is significant. For example, there is a 399% difference between the number 1 worst state (Hawaii) to the number one best state (Nebraska). In other words, Nebraska homeowners get four times more of the premium they pay back to cover losses than homeowners in Hawaii. As a percentage, Hawaii residents get only $0.20 of every $1.00 they pay in premiums back to cover losses. By comparison, Nebraska residents get $0.80 of every $1.00 of their premiums back in the form of loss compensation.
Is Your State One of The Best States for Homeowners?
Being near the top of this list has been good. If your state is near the top of the list, homeowners have saved money over the last several years. However, looking to the future, having been near the top of the list is not good.
States where homeowners insurance ranks high for value are the same states where prices are increasing the fastest. Therefore, if your state is at the top of the list for best values, watch your insurance renewal bill closely. Your next renewal is likely to include a large price increase.
What if Your State is One of the Worst States for Homeowners?
Don’t expect relief anytime soon. The states at the bottom of the list don’t change with the same high frequency as the states at the top of the list. This is because these are more profitable states for insurance companies. When doing business in a more profitable state, there’s no incentive to change the business model.
However, this doesn’t mean the consumer doesn’t have options. Consumers in states at the bottom of the list need to shop more carefully. Using analytics like ValChoice offers will guide consumers to the best solutions. This makes shopping easy, time efficient and cost effective.
Skyrocketing Prices Aren’t New to Homeowners Insurance
Home insurance prices have increased at an average rate of 5.75% per year since the year 2000. This average is across all 50 states. The personal contribution to health care increased at an average rate of 4.66% during the same time period. Surprisingly, from 2000 through 2015 home insurance prices have increased 23% faster than the personal contribution to health care. Home insurance prices double every 12.5 years at this escalation rate. By comparison, health care costs that consumers pay doubled every 15.5 years. The news is really bleak when income growth is measured. Median family income has been doubling every 40 years.
These numbers paints a very negative picture for American consumers. Here’s the translation. Homeowners insurance prices will go up more than eight times by the time median family income doubles.
Unfortunately, this means American families are losing the ability to afford their lifestyle. Yes, American families are losing their lifestyle due to the increasing cost of buying insurance.
The Action Every Consumer Should Take
Finally, consumers have transparency into how insurance companies operate. The data available includes information on how companies price, how well they protect policyholders and the level of service they provide. Consumer need to know the quality of their insurance company. Homeowners buying insurance from a below average insurer needs to switch to a better company.
When consumers begin shifting their business to the best insurers, the insurance industry will undergo a transformation. Consumers will benefit greatly from the transformation. The changes that can be expected include: Prices will increase more slowly. Claims will be settled more easily. Service levels will improve. The power of the purse belongs to consumers.
Find out how good your homeowners insurance company is. It’s simple. Just click the button below and order a free report on your insurance company.
NOTE: ValChoice does not receive any form of compensation from insurance companies for presenting them as a good option. Our analysis is completely independent of the industry.
The Methodology
The analysis ValChoice does is mathematical and based on high-quality data. Insurance financial data analyzed was over the ten-year period. The ten-year period was the most recently reported, 2007 to 2016. A ten-year time period was used to minimize the effect of catastrophic events.
The analysis examined how much of the money homeowners paid for their insurance that was paid out to cover losses. Earned premiums were adjusted for dividends paid to policyholders. Losses paid were measured over the same ten-year period. The ratio of net premiums collected to losses paid was calculated. States with a higher percentage of premiums paid to cover losses were deemed to be a better value.
Data Soures:
Insurance prices, Insurance Information Institute, iii.org.
Personal contribution to health care: Federal Reserve Bank of St. Louis, https://fred.stlouisfed.org.
Earned premiums and losses paid, AM Best Company. Data used by permission.
No comments yet.